Many soil micro studies don't characterize their own soil texture but rather state the texture described as part of the USDA soil series (ex: sandy clay loam). However, a goal of my current incubation experiment is to determine how edaphic properties influence microbially-facilitated C cycling. Because of this, I needed to know the exact composition of the soil texture so I could account for the percent sand, silt, and clay in my analysis.
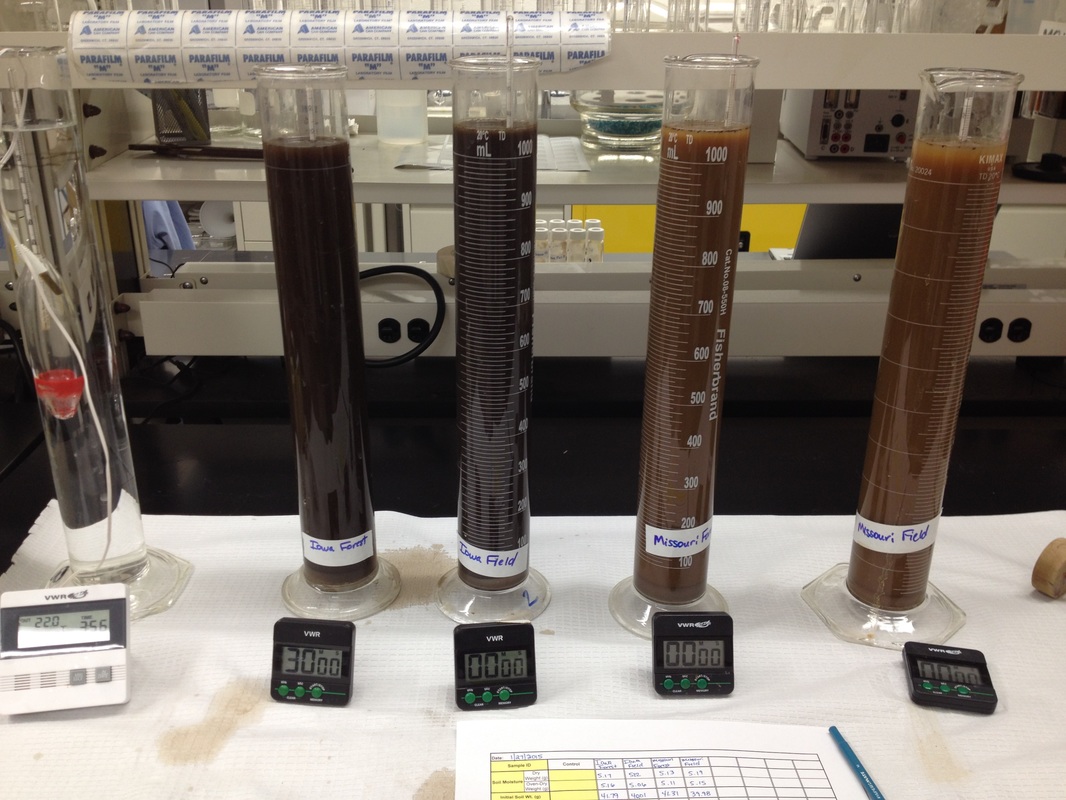
Waiting on silt to settle out before measuring suspended clay particles. Thanks to awesome soil tech Jana for setting these up!
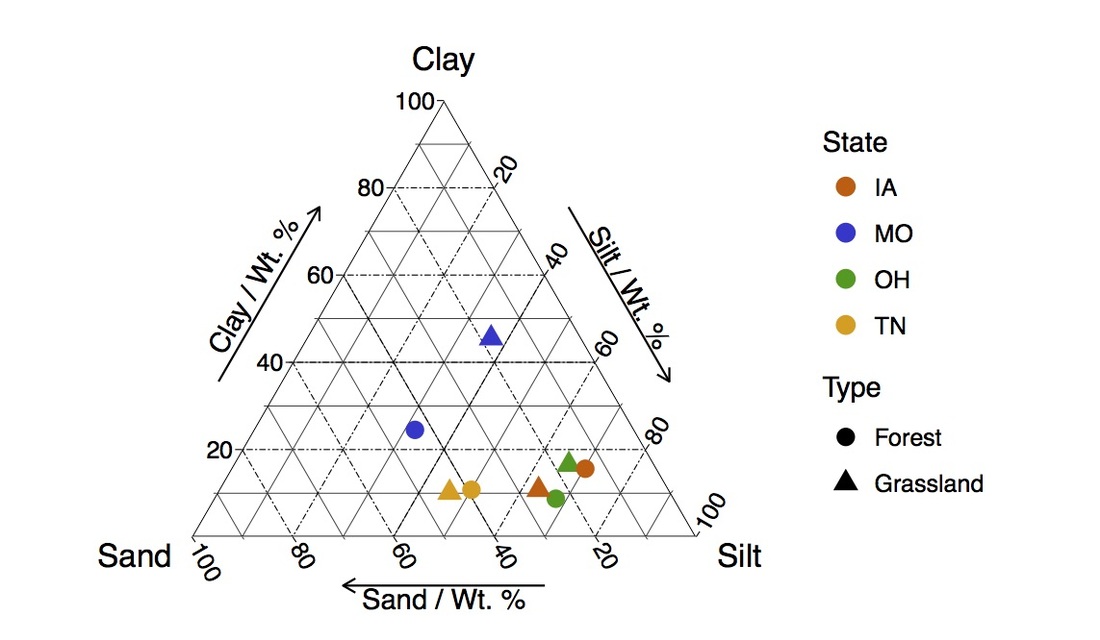
Fast forward to the other night as I was busy preparing data and making figures for the DOE PI meeting coming up in April. I prepared a table of soil properties (% sand, % silt, % clay, %C, %, N, DOC, MBC...) and began to think about how the nuances of soil texture seem to be lost in such a table. I mused about making a ternary figure to represent texture and tweeted to see if other soil folks like the idea.
The response was positive so that evening I ignored the pile of dishes in my sink and played around with ggtern to see how it looked and posted a mockup of the figure.
People seemed to really like the way the figure turned out and I had several requests for the code. I've worked a bit more on the formatting so that the figure better matched other figures from this project. I'm pretty happy with the way this turned out and think this is a nice way to show the variety of soils I used in my experiments. Below are the final figure and code used to to create it.